14 Must-Know Customer Experience Metrics To Boost Retention and Revenue


Brands are alarmingly unaware of the disparity between the service they think they provide and customers’ perceptions of it, according to a paper from IDC.
The paper found that 87% of companies believed they were providing “excellent customer experiences,” but only 11% of customers agreed.
With competition hotter than ever, how can companies close the expectation-experience gap?
It starts with measuring the right customer experience metrics and implementing the right technologies.
In this article, we’ll look at 14 customer experience metrics you should be measuring, including how to calculate your own benchmarks and improve each.
There are plenty of unique metrics customer success, support, and CX leaders have to track depending on your industry vertical. However, some crucial measurements apply to all industries.
Here are 10 critical customer experience measurement metrics to work on for sustainable growth.
Customer satisfaction (CSAT) scores measure how satisfied customers are with specific processes or interactions.
Customers usually rate interactions on a scale of 0-5 or 0-10. Either way, you calculate your average score and multiply by 100 to get a percentage of satisfied customers. This makes all scores comparable as they range from 0-100:
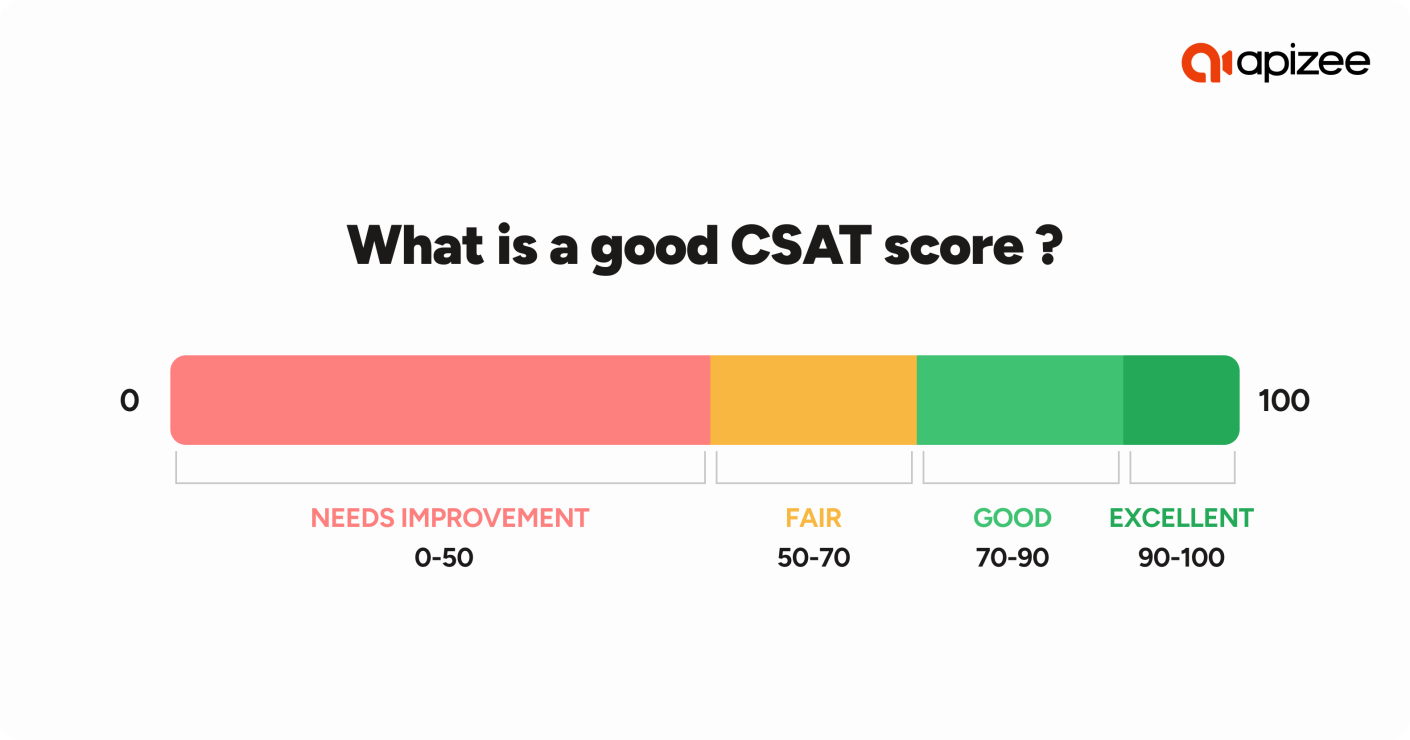
High customer satisfaction scores indicate a fulfilling physical and digital customer experience, whereas low scores mean some touchpoints need attention.
Note: On the other hand, your DSAT (customer dissatisfaction) score is the percentage of customers who rate you poorly.
How to calculate CSAT
You can gather your scores from CSAT surveys using this formula:
([Sum of the positive responses] ÷ [Total responses collected]) × 100 = CSAT
A “positive response” is a rating of four or five on a scale of 0-5 or eight and above on a scale of 0-10.
Let’s say you received 40 survey responses, and 20 of those were positive:
(20 positive responses ÷ 40 total responses) × 100 = CSAT score of 50
A CSAT of 50 is around the “Fair” mark, which means you’re doing some things well but could improve in other areas.
For example, you may have a slick checkout process, but your support team takes too long to respond.
If your scores are lower than you’d hoped, you may want to add open-ended questions to surveys or conduct interviews to find out why (more on that below).
It’s important to note that industry benchmarks for CSAT scores vary widely, so what’s high or low for one company may not be for another. For example, the ACSI suggests internet providers have a benchmark of 68, while ecommerce sites sit at 80.
How to improve CSAT
You can improve your CSAT scores by:
Actively working to improve CSAT shows your customers that you care about their experiences and are serious about adding value to them.
When you make improvements, don’t forget to tell people about it on your site and social media channels.
Net Promoter Score (NPS) measures how loyal customers feel toward your company. Like CSAT, customers score NPS on a scale of 0-10. However, the final score ranges from 0-100 as you tally up percentages of answers.
An NPS score splits your answers into three groups:
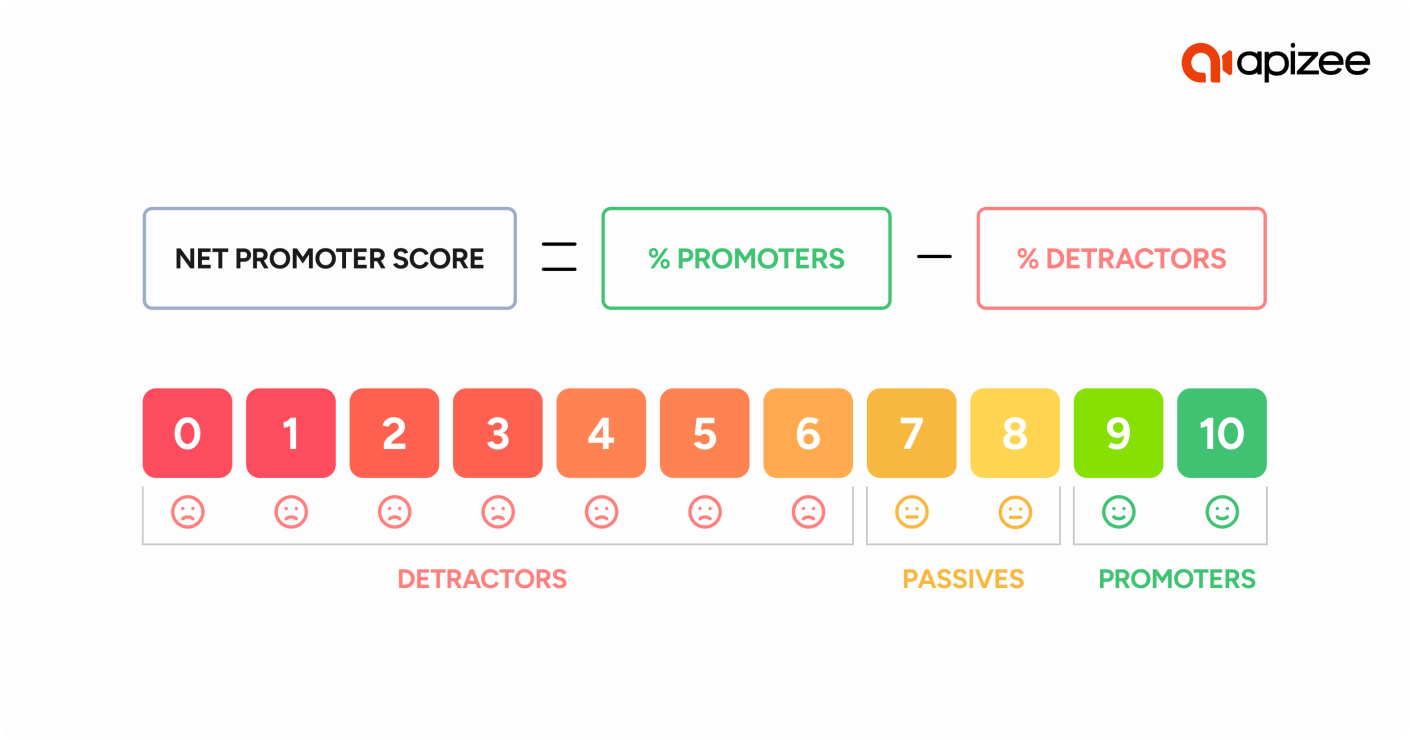
A high NPS score suggests customers view you favorably compared to your competitors, while a low one could be linked to low retention.
How to calculate NPS
Compile your returned NPS surveys and figure out your percentages of promoters vs. detractors. Then, use our Net Promoter Score calculator or this formula to calculate your score:
(% of promoters) - (% of detractors) = NPS
Let’s say you have 200 responses altogether, including 160 promoters, 20 passives, and 20 detractors:
80% promoters - 10% detractors = 70% (an NPS score of 70)
While a score of 39-65 is a typical range for most B2B companies, and 9-74 is common for B2C, NPS benchmarks vary widely by industry, location, survey channel, and company size.
For example, a promising startup tech business may initially have a high benchmark of 67, which drops to 14 as it scales and becomes multinational.
How to improve NPS
You can improve the Net Promoter Score of your company by:
It’s crucial to understand why some customers may have no negative or positive feelings toward your business (the “passives”). Acting on passives’ concerns or feedback can help convert them into positive advocates for your business and improve NPS.
Customer Effort Score (CES) measures how easily customers interact with your product or people. Salesforce research found that 80% of customers believe their experience with a business is just as important as its products or services. So measuring how simple they find interactions is crucial.
You can measure CES with a numerical score, strongly disagree to strongly agree, or smiley to sad emojis. If you choose the latter, you’ll need to assign numbers and a directional scale of minimum to maximum to quantify your score.
For example, you could choose a scale of 1-10, with one representing “None at all” and 10 representing “An extreme amount.”
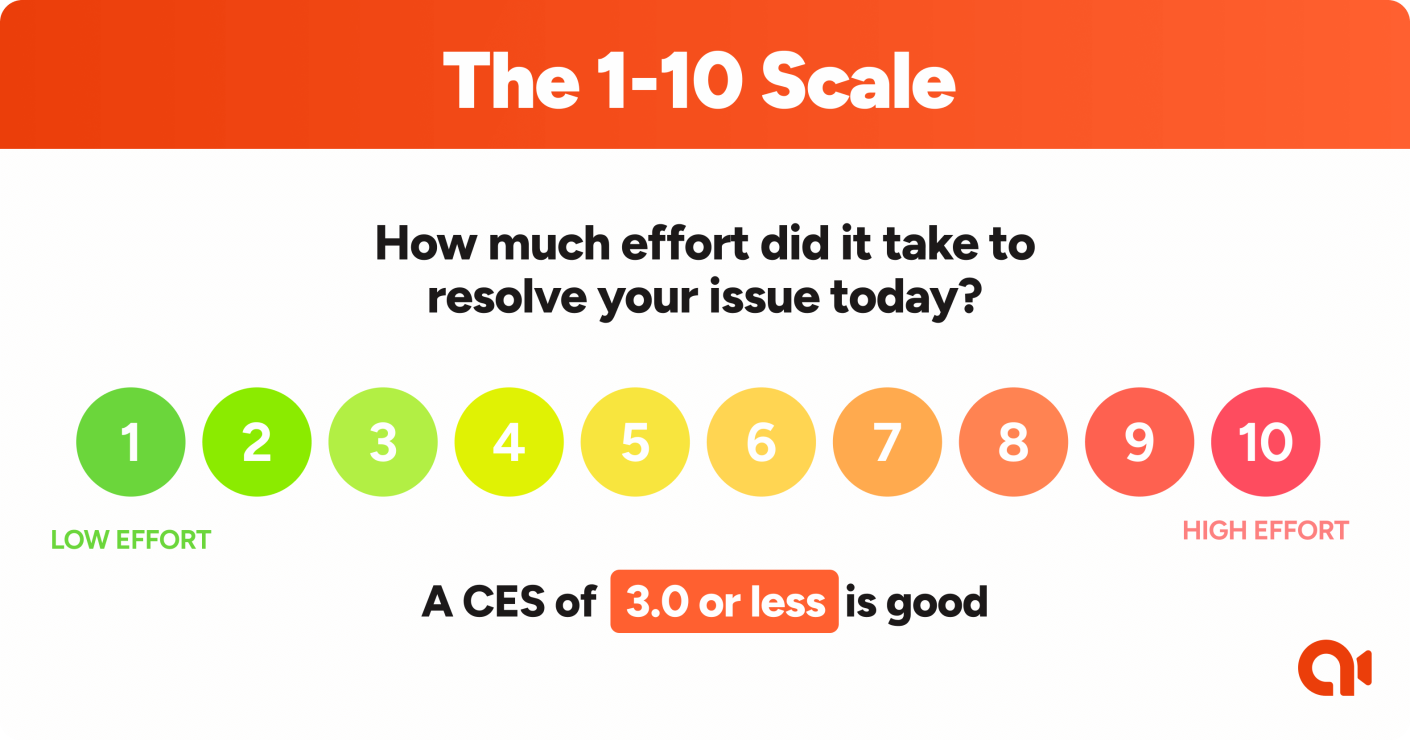
In this case, a low score suggests a seamless support experience, while a high one represents a slow or stressful interaction.
How to calculate CES
Compile your returned CES surveys and use this formula to calculate your score:
(Score total) ÷ (Total number of responses) = CES
Let’s say you get 100 responses, and your CES totals 900:
900 (score total) ÷ 100 responses = CES score of 9
Because there are so many varying ways to measure CES, there are no universal average benchmarks. Your best bet is to calculate your own and try to improve it.
How to improve CES
You can improve your company’s CES by making your user experience flow more smoothly, using tactics like:
Depending on the way you quantify your scale, you may aim for higher or lower numbers as you tweak and optimize your processes.
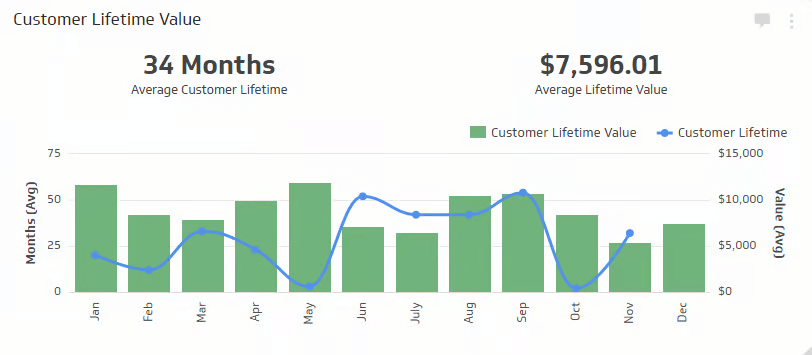
Customer lifetime value (CLV) quantifies the total revenue a business can expect from a single customer throughout their entire relationship.
While NPS suggests customer loyalty, CLV links tangibly to revenue from repeat customers. This can ebb and flow over time, like so:
Source: Klipfolio
Instead of looking at single purchases, this metric can demonstrate the success of your CX as a long-term journey. For example, if many customers cancel subscriptions after a few months, you may need to refocus your acquisition strategy or look into product quality.
How to calculate CLV
To calculate CLV, you need to work out specific revenue and customer averages. Companies will sometimes focus on a specific segment or include other factors, such as acquisition cost.
The important thing here is consistency; always compare metrics worked out by the same formula.
Here’s a simple version of the formula:
(Average purchase value) × (Average purchase frequency) × (Average customer lifespan)
Let’s say an average customer spends €20 every month over 10 years:
€20 × 12 months × 10 years = €2400 CLV
Once you have your benchmark, you can accurately track whether customers spend more or less over a certain period (e.g. quarterly or annually).
How to improve CLV
You can use specific tactics to increase the amount of revenue each customer brings in. For example:
Your findings can help you better understand the value of different customer segments. Then, the data can guide future acquisition strategies to improve long-term CLV.
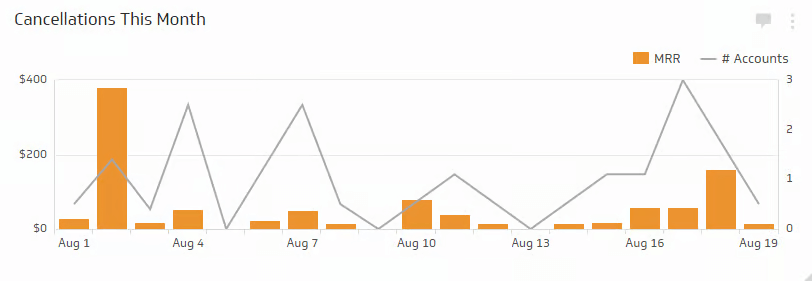
Churn rate (similar to revenue churn) indicates the percentage of customers who stop using a product or service within a certain period. While all businesses naturally acquire and lose customers, a high churn rate can indicate a poor CX.
Software as a service (SaaS) companies that build businesses around monthly or annual subscriptions experience two types of churn: voluntary and involuntary.
Payment processing issues can lead to involuntary churn, while customers can cancel their subscriptions if the product doesn’t meet expectations.
Here’s what these cancellations can look like:
Source: Klipfolio
A high churn rate suggests you aren’t delivering the value you promise your customers.
How to calculate churn rate
To calculate your churn rate, you need to track the number of customers over given periods. Then, use this formula:
([Customers at the beginning of a period] - [Customers at the end of a period]) ÷ (Customers at the beginning of the period) × 100
Let’s say you lost five out of 300 customers you had at the start of the month:
(300 - 295 customers from start to finish) ÷ 300 customers at the beginning of the month × 100 = Churn rate of 1.7%
Average annual churn rate for SaaS companies floats around 5-7%, while a good monthly benchmark sits at 4%.
How to improve churn
You can improve your company’s churn rate by:
There are so many factors that can lead to churn, which makes diagnosing it difficult. However, you need to figure out where these pain points lie to fix them.
First contact resolution (FCR) rate tracks the percentage of customer inquiries or issues resolved in the first interaction.
FCR rate directly reflects the efficiency and quality of customer service businesses provide. It’s a crucial metric to track, with SQM’s research suggesting a 1% improvement can amount to $286,000 in annual savings for an average mid-sized call center.
As well as demonstrating individual and collective customer service agents’ performances, it can highlight efficiencies (or inefficiencies) within internal tools and processes.
For example, FCR may be low because you haven’t trained your reps to be technically proficient with your product to solve complex issues.
This is a crucial differentiator as HiringBranch research suggests reps with the highest amount of role-specific skills become top performers.
How to calculate FCR rate
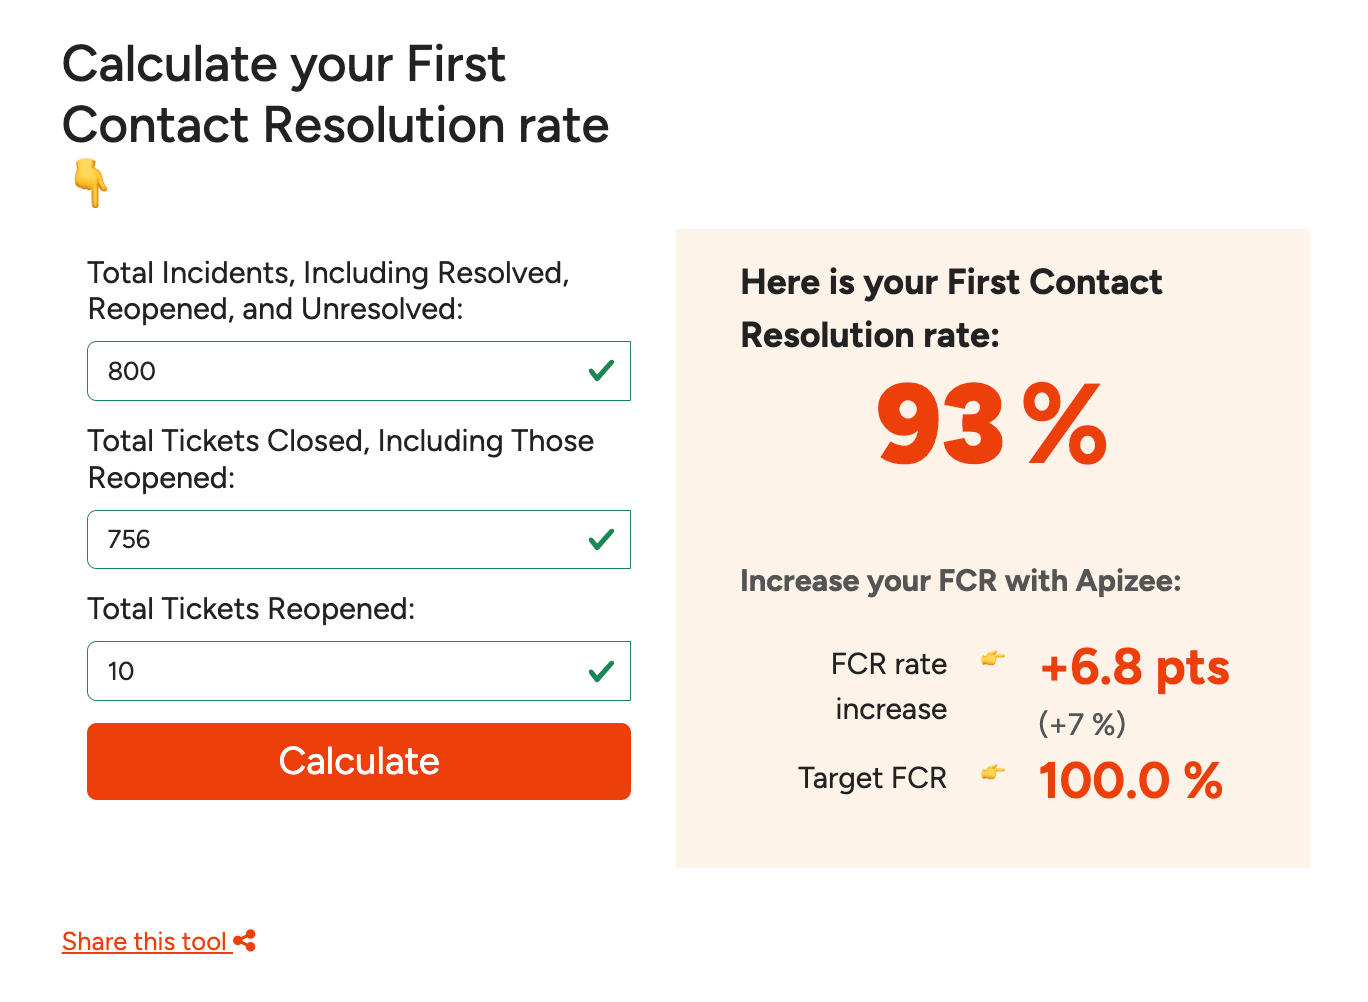
Tally up your interactions and try our first contact resolution calculator to calculate your FCR rate.
Source: Apizee
Or, use this formula to work it out:
(Number of interactions resolved on first contact) ÷ (Total number of interactions) × 100
Let’s say your team had 1000 interactions this month and resolved 750 of them on first contact:
750 interactions resolved on first contact ÷ 1000 total interactions × 100 = 75%
While SQM research finds the average FCR benchmark to be 68%, it’s heavily industry-dependent.
For example, retail businesses with low-complexity queries tend to see some of the highest FCR rates, while technology companies have the lowest.
How to improve FCR rate
Improving your FCR rate involves giving your customer service team the tools and training they need to handle various problems.
You can start by:
Ideally, your FCR rate should be 100%. But there’ll always be complex problems that need more specialized input or take longer to solve.
First response time (FRT) measures the time taken for a support agent’s first interaction after the customer’s initial contact.
You need to know how quickly you get to your customers’ queries and why. For example, your first response time may be high because agents aren’t doing their jobs properly or outdated software can’t support the amount of incoming tickets.
Not everyone expects an instant response. A Userlike survey found that 60% of respondents are happy to wait to speak with a human agent rather than talk to a chatbot immediately.
But if you leave customers waiting too long, they may look to see if your competitors will acknowledge them faster.
How to calculate FRT
To calculate first response time, work out the average time it takes to respond to customer inquiries. You do this with the following formula:
(Total time taken for first response) ÷ (Number of interactions) = FRT
Let’s say your overall first response time is 80,000 seconds across 500 tickets:
80,000 ÷ 500 = Average first response time of 160 seconds
According to Klaus’s Customer Service Quality Benchmark Report, the benchmark for FRT is four hours and 42 minutes. However, it’s important to note that your ideal average times to meet customer expectations can vary widely depending on the platform you use for support.

Source: Klaus
For example, live chat teams answer 80% of chats within 40 seconds, while 69% of social media users expect answers within 24 hours or faster.
How to improve FRT
You can help your agents reply to customers faster by implementing tactics like:
It’s also important to note that what’s acceptable for one demographic may not be the preference for another. According to McKinsey, two-thirds of millennials expect real-time customer service. Keep this age range waiting, and they may not stick around.
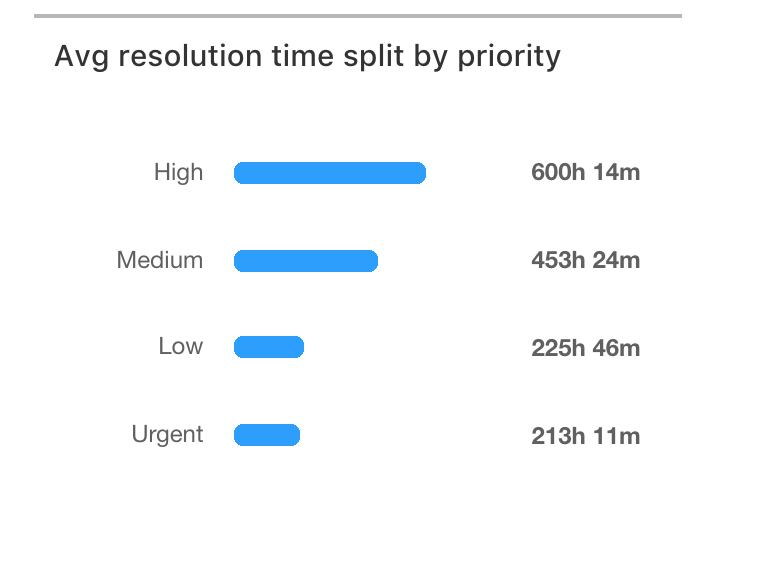
Average resolution time (ART) or average handle time tracks the average time it takes to resolve customer issues or inquiries. This starts with your first interaction and includes any follow-up messages until you resolve the issue.
Your ART can vary widely depending on the priority of the problem. For example, it’ll take far less time for an agent to answer a simple pricing question than a nuanced technical issue the customer has.
Here’s what it can look like when you split your ART by priority:
Source: Freshdesk
It’s natural for high-priority complex problems to take longer to solve than low-priority queries. However, urgent queries should always have the lowest average times.
How to calculate ART
You can use the following simple formula to calculate average resolution time:
(Total time taken to resolve customer issues) ÷ (Total number of issues resolved) = ART
Let’s say it takes you 100 minutes to resolve 40 tickets:
100 minutes ÷ 40 tickets = Average resolution time of 2.5 minutes
ART can vary widely depending on your industry, niche, or how feature-rich your product is. However, your agents’ productivity and contact center technology are the two main factors that can positively or negatively impact your time.
How to improve ART
You can boost average resolution times by giving your agents the motivation and tools they need to do their jobs. For example:
When you equip your team with time-saving tools and in-depth training, they can handle a wide range of interactions without needing escalation.
Note: The work doesn’t always end when the conversation does, so track After Call Work (ACW) time to find out how long it takes to truly wrap up queries.
Customer retention rate quantifies the percentage of customers who continue to buy from your business over a specific period. It reflects your company’s ability to keep existing customers engaged, satisfied, and loyal through your CX.
The exact numbers vary, but experts have long indicated customer retention is a major contributor to a company’s bottom line. Bain & Company once demonstrated that a 5% boost to retention led to a 25% profit boost for its financial clients.
According to ChartMogul’s 2023 SaaS Retention Report:
“Companies with best-in-class retention grow 1.5-3x faster than their peers.”
Holding onto loyal customers also increases the likelihood of positive word-of-mouth marketing, whereas a high turnover can indicate poor product quality or unhappy users.
How to calculate customer retention rate
Use the following customer retention rate formula to calculate your own monthly, quarterly, or annual percentage:
([Number of customers at end of period - Number of new customers acquired during same period] ÷ Number of customers at start of period) × 100
Let’s say you had 100 customers at the start of the month, 95 at the end, and three new customers within that time:
([95 existing customers - 3 new customers] ÷ 100 customers at the start of the month) × 100 = Retention rate of 92%
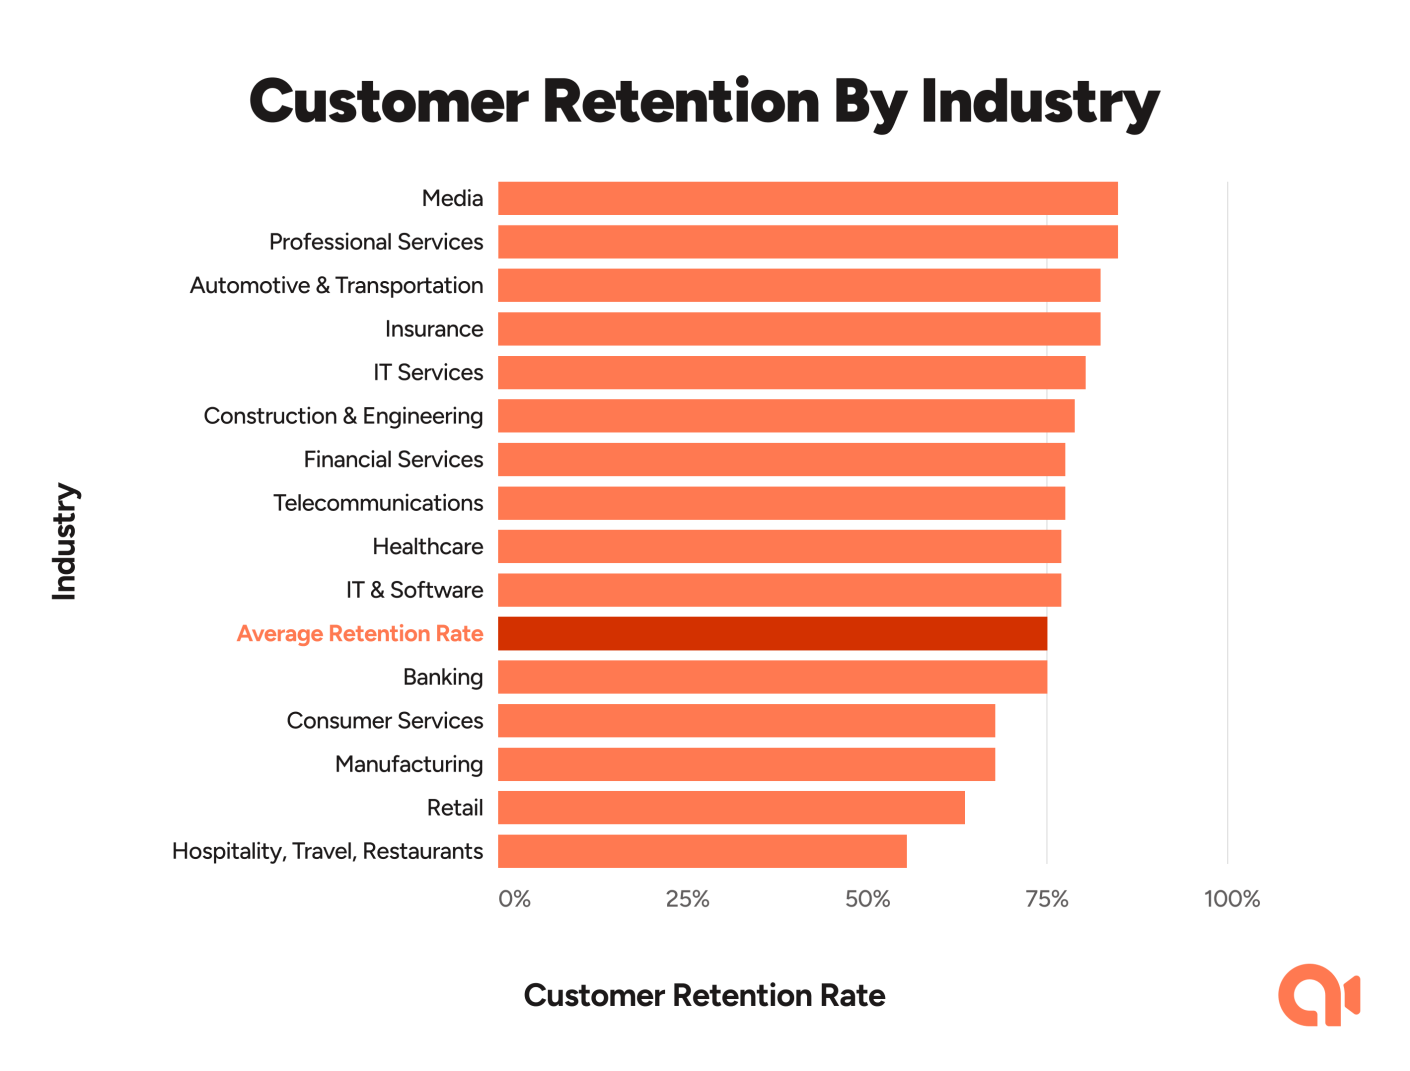
While media and professional services have the highest retention benchmarks of 84%, hospitality, travel, and restaurants fall behind at 55%.
Source: Exploding Topics
From the above 15 industries, the average retention rate is around 75%.
How to improve customer retention rate
A high retention rate starts with a high-quality product or service. However, your CX must continue this perception throughout.
Here are three ways you can increase retention rates:
A churn rate of zero is unlikely. But it’s important to understand why and how you can retain the customers you work so hard to acquire.
“Truck rolls” refers to the number of times a technician or field agent must physically travel to a customer’s location to fix an issue.
Technical industries like telecommunications, utilities, and home services that require on-site visits will track this metric as they often need to send out service personnel for installations, maintenance, and repairs.
The fewer times you have to send out employees, the more time and money you’ll save.
Plus, you’ll put processes in place that allow customers to help themselves and fix problems promptly.
How to calculate the number of truck rolls
You can calculate truck rolls by adding up the number of physical visits you’ve made to customers within a specific time frame.
For example, you may have sent out your technicians 250 times in the past month or 1150 times in the last quarter.
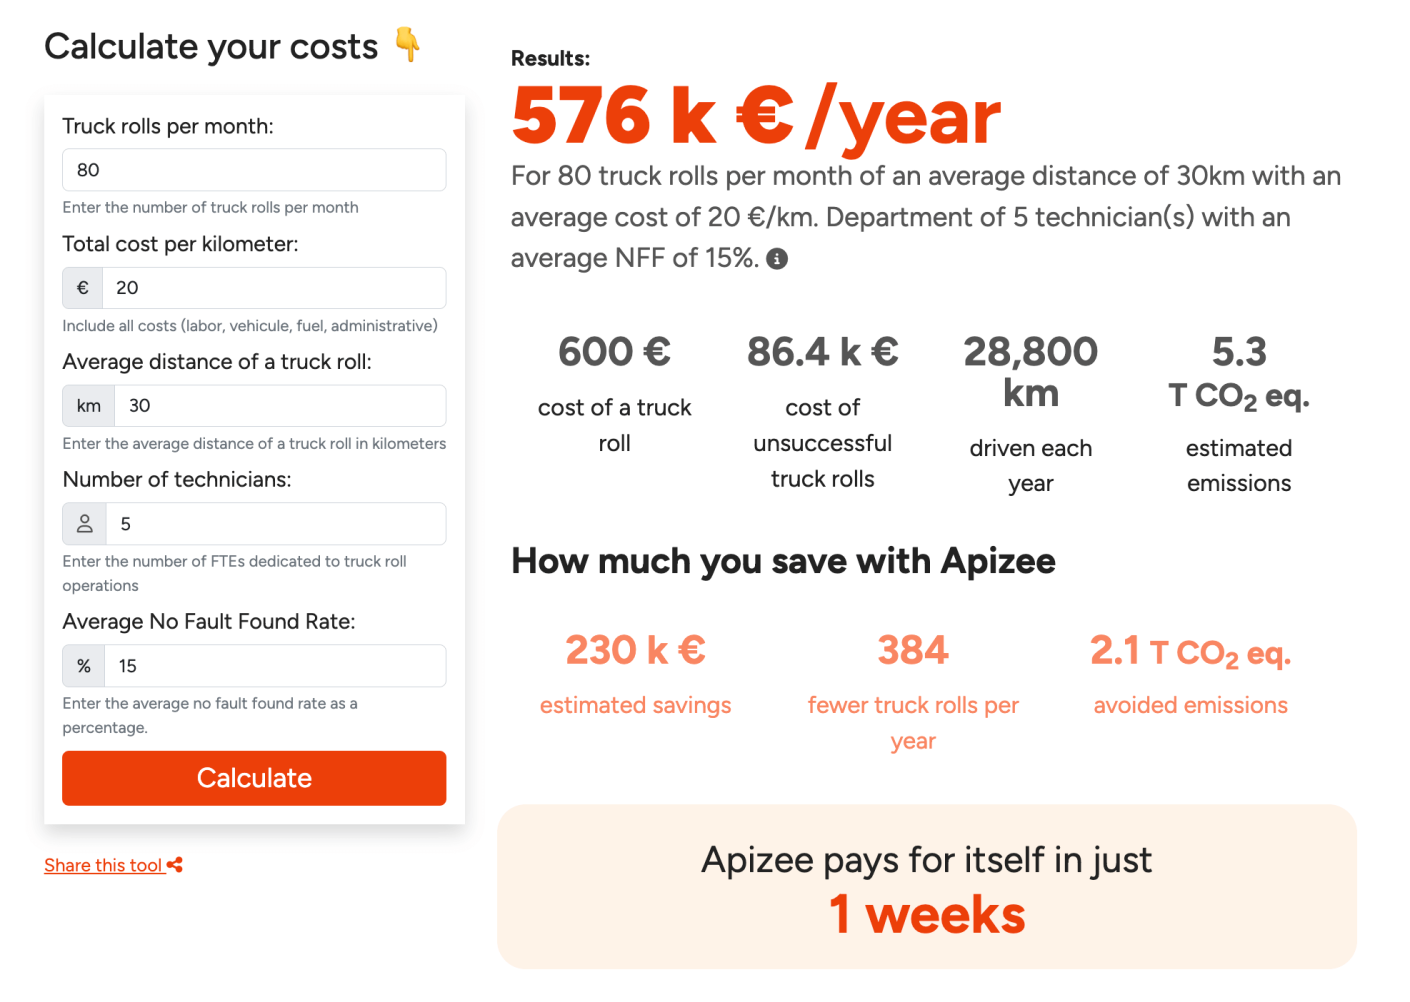
Try our truck roll calculator to estimate how much you could save by offering a visual assistance tool like Apizee.
Source: Apizee
How to improve number of truck rolls
Here are some ways you can improve the efficiency of your callouts:
Reducing truck rolls means fewer in-person visits, cutting travel time and emissions.
Note: You can also use the No Fault Found (NFF) rate to track how often customers return or call in products with no issue. Use the findings to improve troubleshooting guidelines and cut down on costs.
Your company’s core CX metrics may look slightly different depending on your industry, the size of your business, and your vertical.
Here are four more metrics for customer experience leaders to keep an eye on.
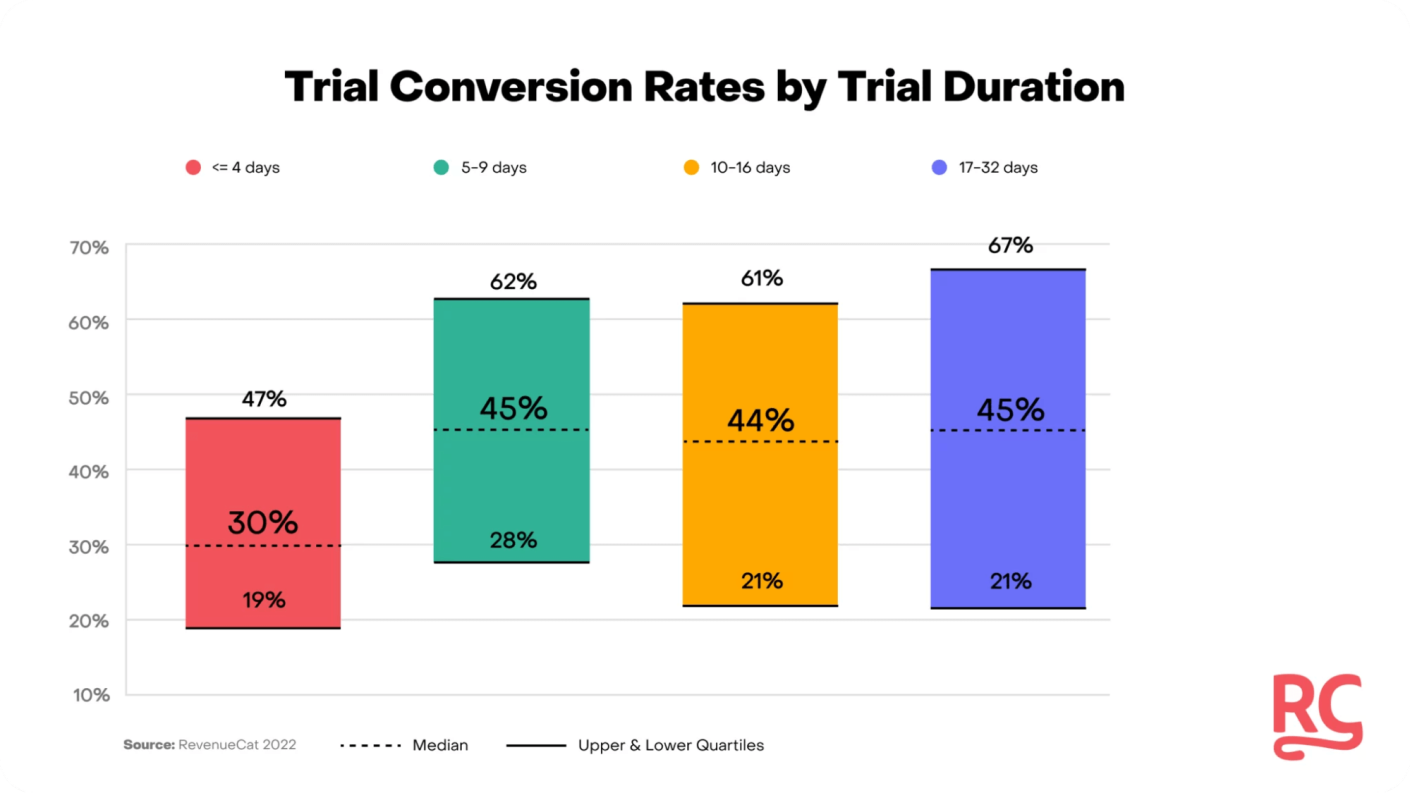
Trial-to-paid conversion rate tracks the percentage of trial users who convert into paying customers.
You may want to track this metric to test multiple trial lengths and find which converts best:
Source: RevenueCat
It allows your team to understand how effectively each trial offering converts users and how much value they got from your product.
How to calculate trial-to-paid conversion rate: (Number of trial users who convert to paid) ÷ (Total number of trial users) × 100
For example, if 80 trial users out of 140 convert to paid, your trial-to-paid conversion rate is 57%.
How to improve trial-to-paid conversion rate: Personalize onboarding, offer conversion incentives, and proactively address concerns or objections.
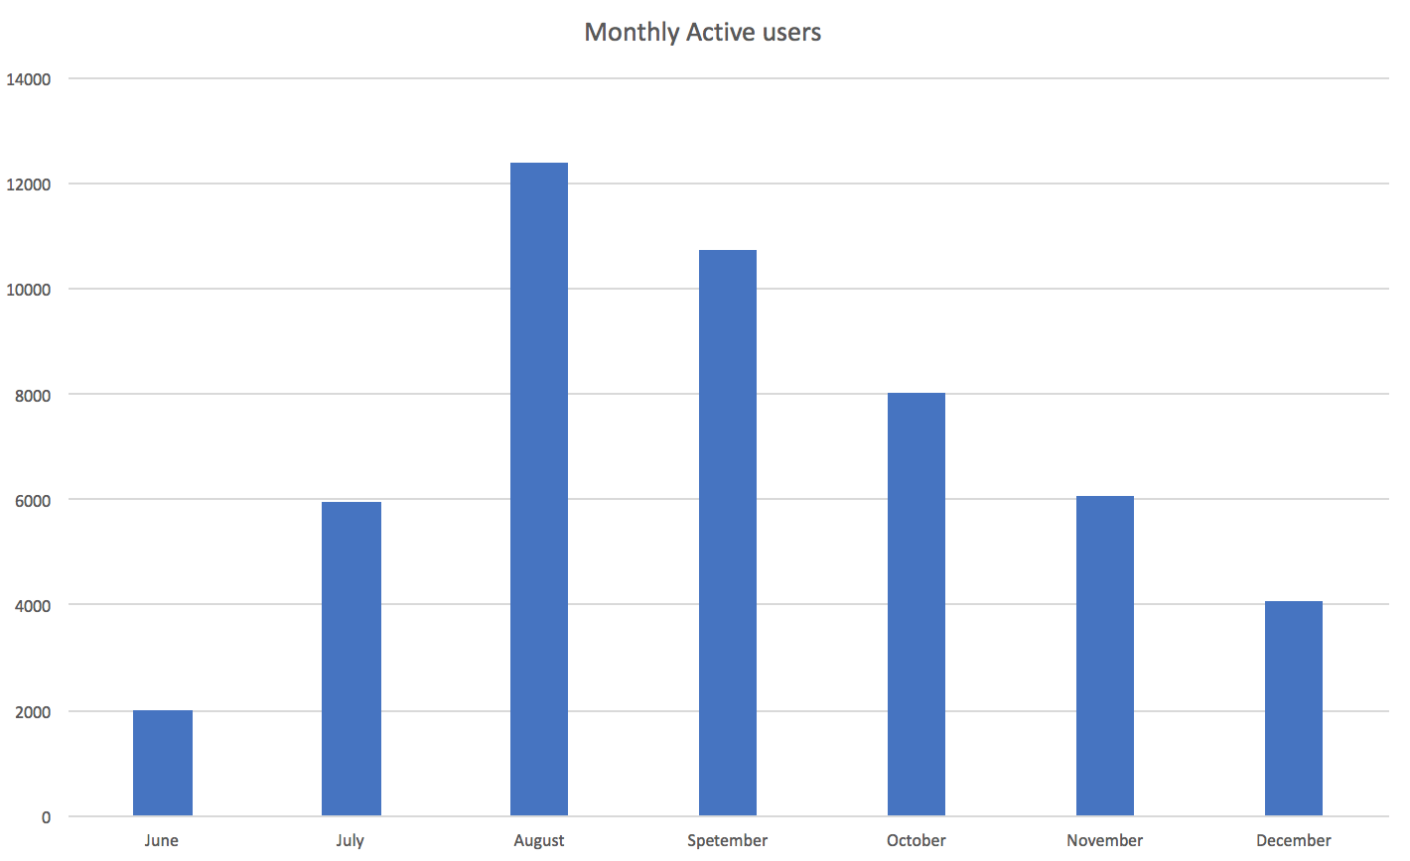
Your monthly active users (MAU) indicates the number of unique users who engage with your product or service within a specific month.
Companies with online products or services will track this metric to determine customer engagement levels over time.
Here’s what yours could look like:
Source: Baremetrics
You can use this data to analyze why customers are more active over certain months than others. For example, you may have rolled out a new update in September that negatively impacted UX.
How to calculate MAU: Track the unique users who engage with their accounts within a given month
If 750 users open your app in May, you have 750 monthly active users.
How to improve MAU: Enhance product features based on user feedback, offer personalized recommendations for features customers may not know about, and optimize your product’s design and UX to make it more appealing.
Customer referral rate tracks the percentage of customers who refer new customers to a business. This can happen in various ways, including referral initiatives, word of mouth, or social media posts.
Banking startup Qonto offers customers €160 for each referral:

Source: Qonto
Referral incentives can be monetary, but you can also offer free gifts, discounts, or vouchers.
Your referral rate indicates how satisfied current customers are and how willing they are to advocate for your product. A high rate can directly impact organic growth and lower acquisition costs.
How to calculate referral rate: (Number of referrals) ÷ (Total number of customers) × 100
For example, if you have 500 customers who refer 25 new customers, your referral rate would be 5%.
How to improve referral rate: Build or optimize a referral program, offer better quality support than your competitors, and personalize small details (e.g. emailing on anniversaries).
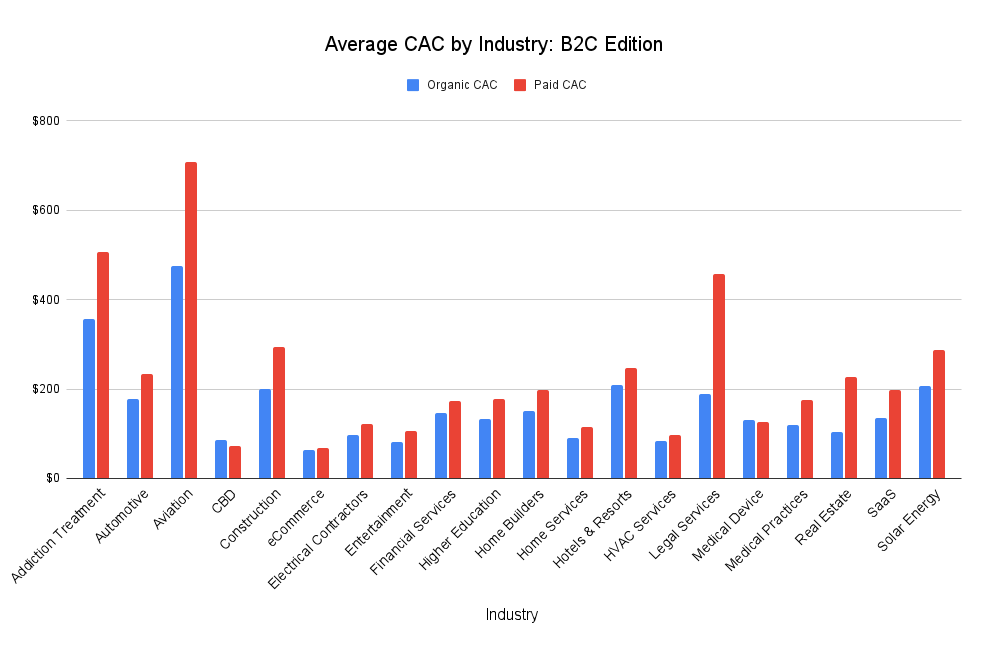
Customer acquisition cost (CAC) measures the average expense (including all marketing, sales, and promotional activities) it takes for your business to land a new customer within a specific timeframe.
Here’s how CAC varies across multiple industries:
Source: First Page Sage
Knowing your current CAC allows you to forecast better and optimize upcoming costs to continue to grow sustainably.
How to calculate CAC: Total sales and marketing expenses ÷ Number of new customers acquired
For example, if you paid €30,000 to acquire 300 customers over the past month, your acquisition cost would be €100 as a starting benchmark.
How to improve CAC: Use current customer data to identify and target high-value segments with your marketing, address bottlenecks in your customer journey, and encourage the cost-effective power of word-of-mouth marketing.
CX KPIs and metrics give you numerical benchmarks to track progress and improvement. However, you should follow three best practices to ensure you don’t misread your data.
Multiple factors, events, and touchpoints influence your customer experience metrics. For a comprehensive picture, you need to understand when and why people feel a certain way.
For example, customers may get frustrated during a staggered onboarding or love your instant support replies. That’s why you need to use a mix of quantitative and qualitative research to paint a clear picture of the overall experience you provide.
You can gather this data on customer behavior through:
Here’s how collaboration platform Miro incentivizes customer feedback through email marketing:

Source: Really Good Emails
In exchange for 45 minutes worth of feedback, customers get a $50 gift card.
Aside from direct surveys and interviews, you can learn how customers feel about your business through:
Each of these formats can give you clues on where to gather more feedback in the customer journey (e.g. shipping experiences) so you can optimize it.
Artificial intelligence is transforming processes and workflows across a range of industries. However, Forbes Advisor research suggests that the most popular use of AI in business is for customer service.
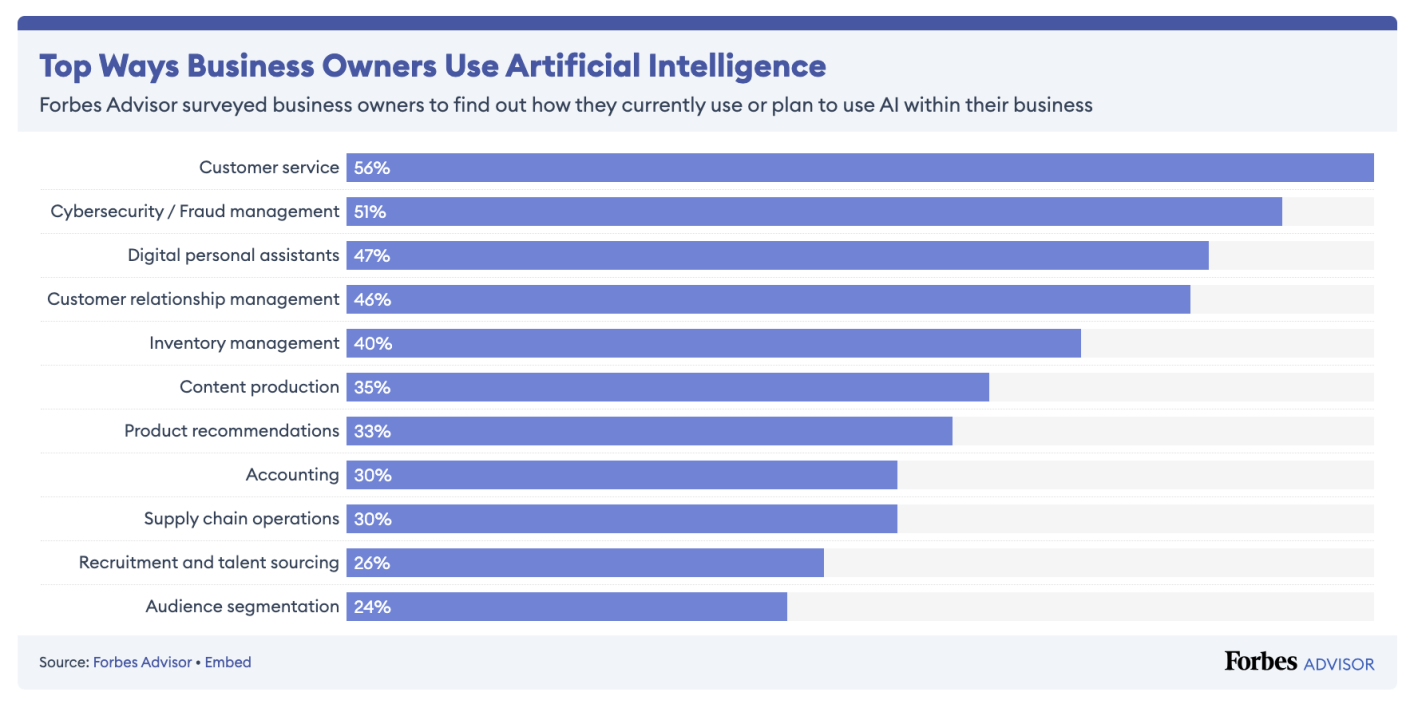
Source: Forbes
It’s likely you’ve already implemented (or are planning to use) some form of AI in your own customer experience management. And you’ll find that the metrics you use to track the performance of AI and human reps often overlap.
Bundling the same metrics together may be tempting so you have fewer groups to track. But it’s important to separate both data sets so you can accurately judge the efficiency of chatbots vs humans.
For example, you may build a chatbot to respond instantly to live chat messages when agents are off at the weekend. However, including these instant replies in the same analysis as human employees (who can only deal with one interaction at a time) will skew your first response time averages.
Separating both groups means you can track boosts in human rep speed or any issues with slow chatbots more accurately.
These AI-specific metrics can also highlight the intersection of humans and technology. For example, your human takeover rate can help you learn how often AI passes queries to human reps. A high rate may indicate your chatbot is inefficient and needs more focused training.
While CX teams naturally focus on your customers, it’s important not to lose sight of your team members on the front lines. Every decision you make should consider your agents and the impact it’ll have on them.
You can ask for regular feedback, but you can also use two specific metrics to track how they feel:
Tracking these metrics gives you more of an understanding of how satisfied and engaged your employees are.
Monitoring changes in your initial benchmarks allows you to proactively identify improvement areas, implement strategies to enhance employee experience, and foster a more productive, stable workforce.
Happier employees are more motivated to provide more fulfilling experiences for customers. So, keep your team satisfied and get ready to see plenty of positive knock-on effects.
Tip: Read about upcoming customer experience conferences to stay updated on more of the latest CX trends and best practices.
You can improve most of the CX metrics in this list by implementing one crucial strategy: personalizing the customer’s experience.
McKinsey research suggests that 71% of consumers expect companies to deliver personalized interactions, and 76% are frustrated by a lack of them.
You can personalize your CX at every stage of the customer journey, from awareness (with contextualized content) to advocacy (with meaningful thank yous). Doing so can boost CSAT, lower CES, and improve retention.
While using someone’s first name now feels standard, you can offer different types of visual assistance that most companies aren’t.
For example, using Apizee, customers can hop on a video call with an expert to help them fix problems remotely and cut time-to-resolution metrics by 50%.
You can also offer extras like screen sharing, co-browsing (a more secure form of screen sharing where both parties can interact on the same page), and annotations.
Here’s one way you can implement Apizee:
Apizee’s secure click-to-video functionality means they don’t need to download software to get faster resolutions, improving customer satisfaction by 48%.
Use it to assist your customers in a visual format with only a few clicks on any device.
Mapping your entire customer journey is critical to understanding how customers feel across every touchpoint with your business.
Only when you understand where you delight customers or cause them to drop off can you truly impact KPIs like CSAT and retention rate.
It can also help to speak to customers directly to get a feel for the experience you provide through tone, facial expressions, and body language. Humanizing this process can also supplement hard facts and numbers with emotions and unique insights.
Apizee can facilitate more personalized, engaging support interactions that customers appreciate and help you stand out from your competition.
Learn howDiscover how the LEARN method helps customer service teams listen, empathize, and resolve issues more effectively—plus real examples and video support tips.
How the LEARN Method Improves Customer Service Communication
27 Jan 2026
Learn how the HEARD method helps customer service teams resolve complex issues with empathy, structure, and clarity—plus examples and video support tips.
How the HEARD Method Improves Customer Service (With Real Examples)
16 Jan 2026
Awaab's Law gives social housing tenants new rights from October 2025. Here’s what you need to know about the new UK legislation on damp and mould in social housing.
What is Awaab's Law? New UK Legislation for Social Landlords
16 Jan 2026
Interested in our solutions?